A Performance Testing Methodology
The primary goal of any web site performance testing and capacity planning activity is to know how many users can our system handle under acceptable response times given certain hardware specifications. We can get this information by graphing a concurrency vs response time graph.
A typical graph looks like this:
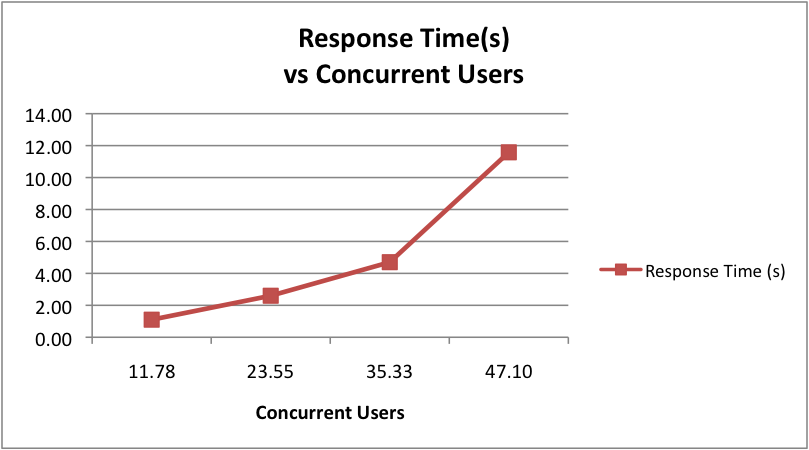
Note how the curve grows exponentially. Depending on the nature of the website (or web pages) under test you might have different acceptable response times. For example, if you’re testing a service for uploading large images asynchronously, you might be able to tolerate larger response times. In general, however, response time should be a non-functional requirement defined by your project’s stakeholders.
I will now go through a standard methodology for obtaining a graph like this.
Performance Testing Concepts
Let me start by defining some important concepts:
- Arrival Rate: The rate at which requests arrive to the system.
- NActive: The number of active users in the system, either being serviced or waiting.
- NConc: The number of concurrent users being serviced in the system. This is the number we want to graph against the response times.
- Service Time: The average response time for a given request when the system is under no load.
- Think Time: The time a user spends between requests, for example reading a webpage.
- Duration of Stay: The average time a user spends in the system. Also called wait time or session duration.
Getting Useful Data
The first thing to do is to obtain some data:
- Number of visitors per month (or Arrival Rate) we expect.
- Average time a user spends in the site (or Duration of Stay)
- Number of pages that the user visits on average.
For existing websites, these numbers are typically known or can easily be calculated by parsing web server access log files (e.g. Apache access logs). For new websites it’s a little bit more trickier as you’ll have to do some investigation. You might consider talking with your customer and business analyst.
One thing to note is that, specially for new sites, the number of expected visitors is a ballpark number and it does not need to be exact. We need it as a starting point for our concurrency calculations. In these cases, setting some assumptions is a valid thing to do.
For this example we’ll use the following numbers:
- Number of visitors per month: 100,000
- Duration of stay per visitor (on average): 5 minutes
- Average number of clicks per user: 10
We will also assume that the bulk of the visits happens in the course of 12 hours. Often you have to do this sort of adjustments. Again, for existing websites this can be obtained by analyzing access logs, but for new websites you can make assumptions. For example, if you’re working on an e-commerce site that sells goods in the US, the bulk of your sales will likely happen during the day.
Active Users
The first thing we need to do is to calculate the number of active users (or NActive) at any given time. We can obtain this using Little’s Law:
NActive = λW
where λ is the arrival rate and W is the duration of stay (also called wait time). We can calculate our arrival rate in visitors per minute by doing some simple math:
λ = 100,000 users/month 100,000/30 = 3,333 users/day
3,333⁄12 = 278 users/hour 278⁄60 = 4.63 users/minute
With our arrival rate in users per minute we can obtain the number of active users at any given time by multiplying by the duration of stay:
NActive = λW
NActive = (4.63 users/min) * (5 min)
NActive = 23 users
This means that on average, there are 23 users in the system, either waiting a response from the server or doing something else. In other words, at any given time there are 23 sessions on the server.
Think Time
If we know the average number of requests per user (rpu) and we know the average time each user spends in the site (W), calculating the average think time (Z) or time between requests is pretty straightforward:
Z = W/rpu
Z = 300sec/10
Z = 30 sec
We will use this number for our concurrency calculation.
NConc or concurrent users
The number of concurrent users at any given time is a function of the number of active users and the percentage of time users are waiting for a request to complete. Mathematically speaking:
NConc = NActive( R / ( R+Z ) )
where NConc is the number of _concurrent users_a at any given time, NActive is the total number of users in the system, R is the service time and Z is the think time.
We have calculated all these numbers except the service time. As mentioned before, this should be known for existing websites or should be relatively easy to obtain via the logs. Another common practice is to perform benchmarking tests to obtain the average response time of each request when the system is under no load. For this example we’ll assume that our service time is of 1 second.
With the numbers we have, we can calculate the number of average concurrent users in our system:
NConc = NActive( R / ( R+Z ) )
NConc = 23( 1 / (1 + 30) )
NConc = 0.74 users
The calculated average concurrency is of 0.74 users. This makes sense given our numbers. The cool thing about this formula is that we can simulate higher concurrency just by varying the think time. As the think time is shortened, the concurrency increases. This is very useful when running our load tests because we are able to simulate higher loads in the system by using the same number of threads, hence saving computing resources.
Writing our load tests
With the information we have we’re now ready to write our test scripts. The way we write our tests will vary depending on the tool we use (e.g. JMeter and httperf are both great open source tools). I’ll write about the creation of load tests in another article, but in a nutshell, you’ll need the following information:
- NActive, or number of users (or threads) to simulate.
- Think time, or time to wait between requests.
Getting your graph
What you’ll want to do is then run the load tests for some time to obtain average response times as well as std. dev, median, 90th and 99th percentiles. Five minutes is a good rule of thumb for running your load tests, but you might also consider running longer tests for stressing the system. Then, you’ll want to run your tests again using higher loads (e.g. by varying the think time or number of threads). You’ll want repeat this several times (e.g. 5 - 10 times) until you have enough data points to plot a nice graph.